Simulation FAQs
CONTENTS:
- What do the user settings mean?
- What do the control sliders do?
- What do the monitor outputs mean?
- How do I read the monitors when the values keep changing?
- What do the dots mean and why are there sometimes more dots than others?
- Can I use this simulation to design a real system for desalination by electrodialysis?
What do the user settings mean?
The following user settings are required for the simulation program to create your simulation. You may either use the default values (just click OK) or replace them with different values, as long as they are in the ranges indicated in the form.
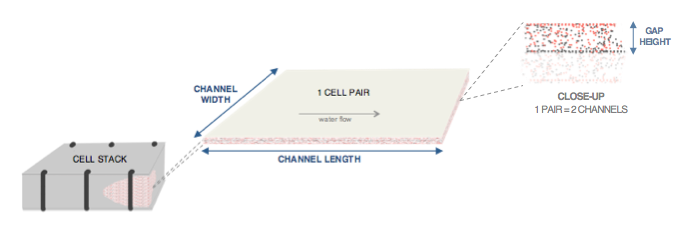
CELL DIMENSIONS and CELL PAIRS PER STACK
Gap height, channel length, and channel width refer to the dimensions labeled in the diagram. Cell pairs per stack refers to the number of cell pairs working as a unit between the two electrode plates that generate the electric field.
CONCENTRATIONS
Feed water refers to the saltwater that is pumped into the channels. Salinity refers to the concentration of salt in water, typically expressed in units of parts per thousand (ppt). In this simulation, the salt is considered to consist entirely of sodium chloride (NaCl). Note that 10 ppt is the same as 1 percent or 10 grams salt for 1 liter of water: for example, 35 ppt means 3.5% or 35 g/L. Target salinity refers to the allowable concentration of salt for the desalinated water.
COST
Since desalination by electrodialysis requires a lot of electricity, the simulation needs to know the price of electricity to predict the cost. Utility companies generally measure electrical energy in kilowatt-hours (kWh). You may wish to look up the current cost of electricity per kilowatt-hour in order to obtain a more realistic cost estimate.
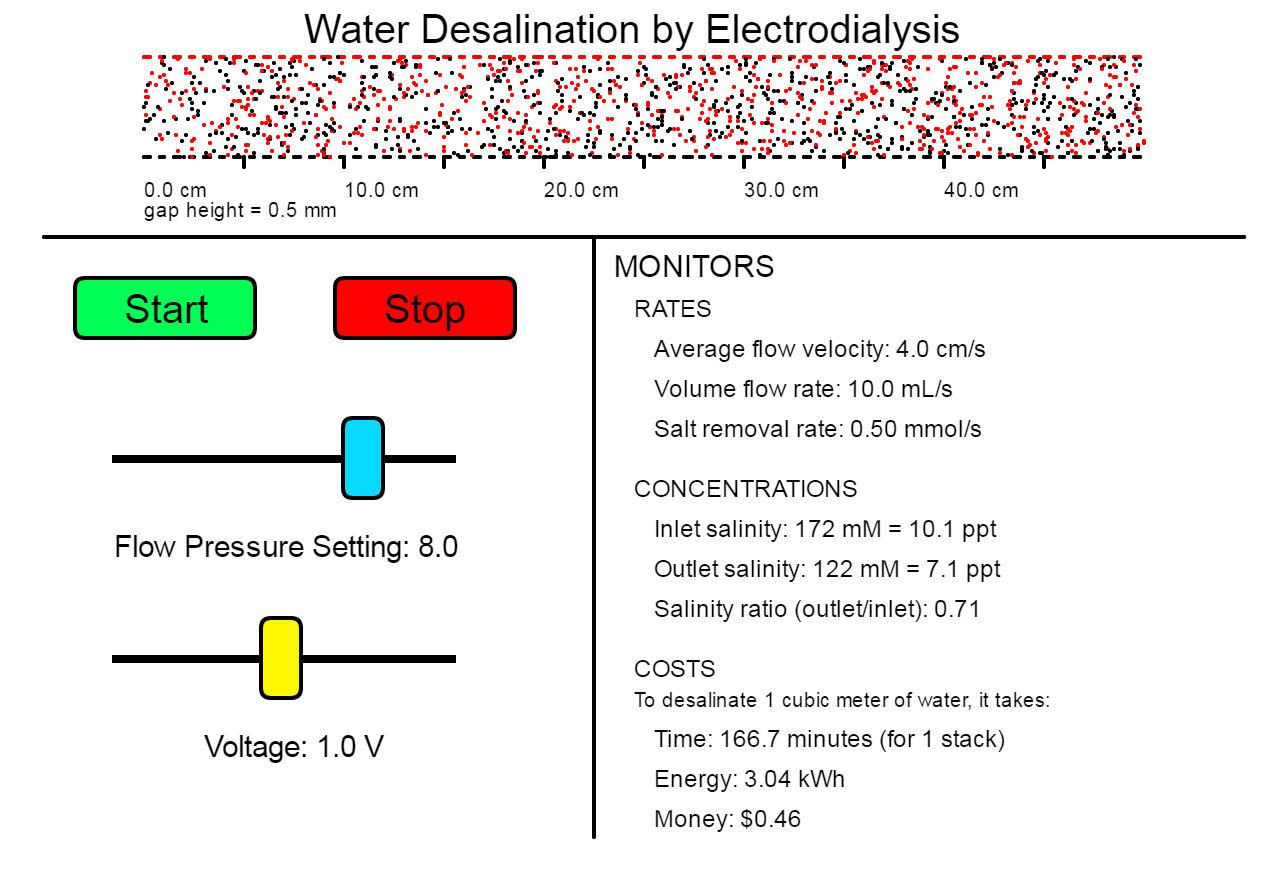
What do the control sliders do?
The control sliders allow you to explore how flow pressure and voltage affect the desalination process.
FLOW PRESSURE SETTING
The flow pressure setting controls how much pressure is used to move water (and salt ions) through the cell pair. No units are provided, but a setting of "10" means ten times as much pressure as a setting of "1".
VOLTAGE ACROSS CELL PAIR
In an electrodialysis system, electrodes actually create a voltage across an entire cell stack. However, in this simulation, the voltage slider controls how much voltage is applied across a single cell pair. For example, when the voltage slider is set for 0.5 V, this would actually correspond to 300 V across a 600-cell pair stack.
What do the monitor outputs mean?
RATES
The flow of water throught the channel is fastest in the middle of the channel, and slower near the walls. Average flow velocity reports the average of these speeds in cm/s and depends on how much flow pressure has been applied.
Volume flow rate reports how many milliliters of water pass through the channel per second.
Salt removal rate indicates how quickly the water is being desalinated. The unit "mmol" represents 1/1000th of a mole (or approx. 6 x 10²⁰ ion pairs) of salt.
CONCENTRATIONS
There are concentration monitors at both the inlet (where the feed water enters) and outlet (where the desalinated water exits) of the channel. The concentrations are reported in both mM (millimoles per liter) and ppt (parts per thousand), with the assumption that the salt is sodium chloride (NaCl).
COSTS
The time, energy, and money costs report the number of minutes, kilowatt-hours (kWh) of electricity, and dollars (respectively) required to process 1 cubic meter of water. To give a sense of scale, that's approximately the amount of water a water-conscientious American uses in 3 days.
How do I read the monitors when the values keep changing?
When you change the parameter settings using the control sliders, it takes time for the simulation to react to the changes. It is recommended that you wait patiently for the values to stop adjusting before you read the monitors and/or make further changes to the parameter settings.
However, for a number of different reasons, the values reported by the monitors fluctuate even when you have not changed the controls (or have waited for the values to "settle" after a change). If you need to record specific values, one way to deal with the fluctuations is to watch for a set amount of time, noting the minimum and maximum values during that time interval, and record a number roughly halfway in-between.
What do the dots mean and why are there sometimes more dots than others?
The dots represent the sodium and chloride ions from dissolved salt in the water. The red dots are the positive Na+ ions (cations), and the black dots are the negative Cl– ions (anions). The simulation doesn't actually show all the ions: instead, the number of dots shown is proportional to the salinity.
Can I use this simulation to design a real system for desalination by electrodialysis?
This simulation is for educational and entertainment purposes only. Although an effort has been made to make both the visualization and quantitative elements realistic, a large number of assumptions and simplifications have been applied.
Simulation Applet
What Can I Do With This Simulation?
BASIC CHALLENGE
In this challenge, you will design a desalination process using the simulation. You will need to decide the dimensions of your cells and cell stack, the flow pressure level, and the amount of voltage to apply.
Your Mission: Design a process to desalinate brackish water with salinity 7 ppt into drinkable water (no more than 1 ppt) for as little cost per volume as you can.
Think you got it? Try Additional Challenges....